Our High Ambition pathway for the United States (U.S.) shows a 63-67% reduction in total greenhouse gas (GHG) emissions (including Land Use, Land Use Change and Forestry (LULUCF)) from 2005 levels by 2035. Reflecting recent federal policy rollbacks, our latest and detailed assessment also shows that a 54-56% reduction can be delivered by 2035, primarily through non-federal leadership. Despite the current federal administration’s withdrawal from the Paris Agreement, previously announced Nationally Determined Contribution (NDC) targets have committed to reducing emissions by 61-66% by 2035 and 50-52% by 2030 from 2005 levels, and to achieving net-zero emissions by 2050.1,2 U.S. GHG emissions, including LULUCF, peaked in 2007 and decreased by 20% from the peak by 2023.
Since January 2025, redirections of federal funding, policies, and regulations have created uncertainties in the U.S. climate and energy transition. However, opportunities remain to support continued economy-wide emissions reductions through strong non-federal climate leadership. States and cities retain significant policy authorities to drive climate action, while industry and business actors can continue to invest in clean energy technologies. Electricity-, transport- and methane-related emissions are key opportunities for non-federal action in the near-term, though decarbonizing other sectors like industry and buildings will be critical for deeper reductions to meet the net-zero target. Important near-term actions include accelerated renewable energy targets, methane intensity standards, investments in EV adoption and infrastructure, vehicle miles traveled reduction policies, building appliance electrification targets, and more.
2035 Target: Total GHG Emissions Reductions
via CGS High Ambition Pathways
-63 to -67%
Relative to NDC Base Year
2005
Official 2035 NDC target
-61 to -66%
Official 2030 NDC target
-50 to -52%
Net zero target
2050
A High Ambition pathway for the United States shows a 63-67% reduction in total GHG emissions, including LULUCF, by 2035 from 2005 levels (Figure 1). In this pathway, emissions decline faster through 2035, reaching a 50-54% reduction in 2030 and a 63-67% reduction by 2035. However, recent reversals in federal climate policies have created challenges for reaching this pathway. The Non-Federal Leadership scenario accounts for current federal policy rollbacks and assumes that non-federal actors advance their climate policies. Under this scenario, GHG emissions (including LULUCF) decline more slowly than in the High Ambition pathway, leading to a 36-40% reduction by 2030 and a 54-56% reduction by 2035 from 2005 levels. The upper bound of this range assumes that all non-federal actors accelerate climate action and that the federal government re-engages on climate policy after 2028. The lower bound assumes that only climate-leading states adopt high-ambition policies, with some level of enhanced action from the non-leading states, without any re-engagement from the federal government. In contrast, under the Current Policies scenario, which includes federal policy rollbacks and existing non-federal policies, GHG emissions (including LULUCF) decrease gradually through 2030, with a slower decline after 2030, achieving 30% and 35% of emissions reductions by 2030 and 2035 from 2005 levels, respectively.
The United States’ total GHG emissions peaked in 2007 and declined by 20% from peak levels by 2023, driven largely by reductions in the power CO2 and industry CO2.5,9 The 2030 NDC targets a 50-52% reduction from 2005 levels, the 2035 NDC aims for a 61-66% reduction from 2005 levels, and aims for net-zero by 2050.2,1 Our analysis suggests that achieving the 2030 and 2035 targets will require annual reductions of 6-7% from 2023 levels through 2030 and 2035, which is higher than the current annual reduction rate of 1% between 2007 and 2023. Progress toward these targets has been mixed, with challenges from delayed policy uptake and infrastructure buildout, recent federal policy reversals, and limitations in scaling emerging clean energy technologies.
As of 2024, 58% of total electricity generation came from fossil fuels, with gas contributing 43%, coal 15% and other sources 1%. Renewables accounted for 24% with solar and wind representing 7% and 10% respectively, while nuclear contributed 18% (Figure 2).4 Solar and wind capacity increased fourfold over the last decade, reaching 330 GW in 2024, with more than 40 GW built in the past year. Gas generation increased by 66% during this period, supported by a 20% increase in capacity, while coal generation declined by 59%, with capacity decreasing by 40%.4
Under the High Ambition scenario, 82% of the U.S electricity generation comes from non-fossil fuel sources by 2035 with 68% from renewables and 14% from nuclear. This scenario maintains hydro and nuclear generation from historical levels, while accelerating solar and wind deployment, phasing out coal, and reducing gas generation. Specifically, power sector transitions under the High Ambition pathway include:
- Increasing the share of solar and wind from 17% in 2024 to 42% by 2030 and 62% by 2035, by accelerating wind and solar deployment from 40 GW/year in 2024 to 102 GW/year from 2025 to 2030, and 110 GW/year from 2030 to 2035.
- Phasing out coal by 2030.
- Reducing gas generation by 48% by 2035 from 2024 levels.
The fossil fuels industry makes up a significant share of the U.S. economy, comprising nearly 8% of the nation’s GDP, as the U.S. produces 22.4% of the global natural gas supply and ranks first in global domestic production.11,12 The industry can expect to grow further under shifting federal priorities. Under our High Ambition pathway for the U.S., domestic coal demand declines by 80% by 2030 and 85% by 2035 from the 2024 level, while gas demand falls by 20% and 35%, and oil demand decreases by 26% and 40%, respectively, from 2023 levels (Figure 3).
Citations
- Government of the United States of America. The United States of America Nationally Determined Contribution. Reducing Greenhouse Gases in the United States: A 2035 Emissions Target. (2024).
- Government of the United States. The United States of America Nationally Determined Contribution. Reducing Greenhouse Gases in the United States: A 2030 Emissions Target. (2022).
- U.S. Environmental Protection Agency. Inventory of U.S. Greenhouse Gas Emissions and Sinks: 1990-2021.
https://www.epa.gov/ghgemissions/inventory-us-greenhouse-gas-emissions-and-sinks-1990-2021 (2023). - Ember. Electricity Data Explorer - Open Source Global Electricity Data. Ember (2025).
- Hoesly, R. et al. CEDS v_2025_03_18 Gridded Data 0.5 degree. Zenodo (2025).
- Zhao, A. et al. U.S. Climate Pathways for 2035 with Strong Non-Federal Leadership.
- Zhao, A., O’Keefe, K. & Kennedy, S. Toward 2035: Forging a High-Ambition. U.S. Climate Pathway.
https://cgs.umd.edu/sites/default/files/2024-09/CGS_Toward%202035_Forging%20a%20High-Ambition%20US%20Climate%20Pathway_September%202024.pdf (2024). - NGFS. NGFS Climate Scenarios for Central Banks and Supervisors - Phase V. The Central Banks and Supervisors Network for Greening the Financial System (NGFS) (2024).
- Gütschow, J., Pflüger, M. & Busch, D. The PRIMAP-hist national historical emissions time series (1750-2023) v2.6.1. Zenodo
https://doi.org/10.5281/zenodo.15016289 (2025). - KPMG & Kearney. Statistical Review of World Energy, 73rd Edition. Energy Insitute
https://www.energyinst.org/statistical-review/resources-and-data-downloads (2024). - American Petroleum Institute. Oil & Natural Gas Contribution to U.S. Economy Fact Sheet. API
https://www.api.org/news-policy-and-issues/taxes/oil-and-natural-gas-contribution-to-us-economy-fact-sheet (2018). - IEA. World: Natural Gas. IEA
https://www.iea.org/world/natural-gas (2022).
Our Work
Other CGS Research
Pathways to 2035: Expanding non-federal climate leadership in the United States
Enhancing Global Ambition for 2035: Assessment of High-Ambition Country Pathways
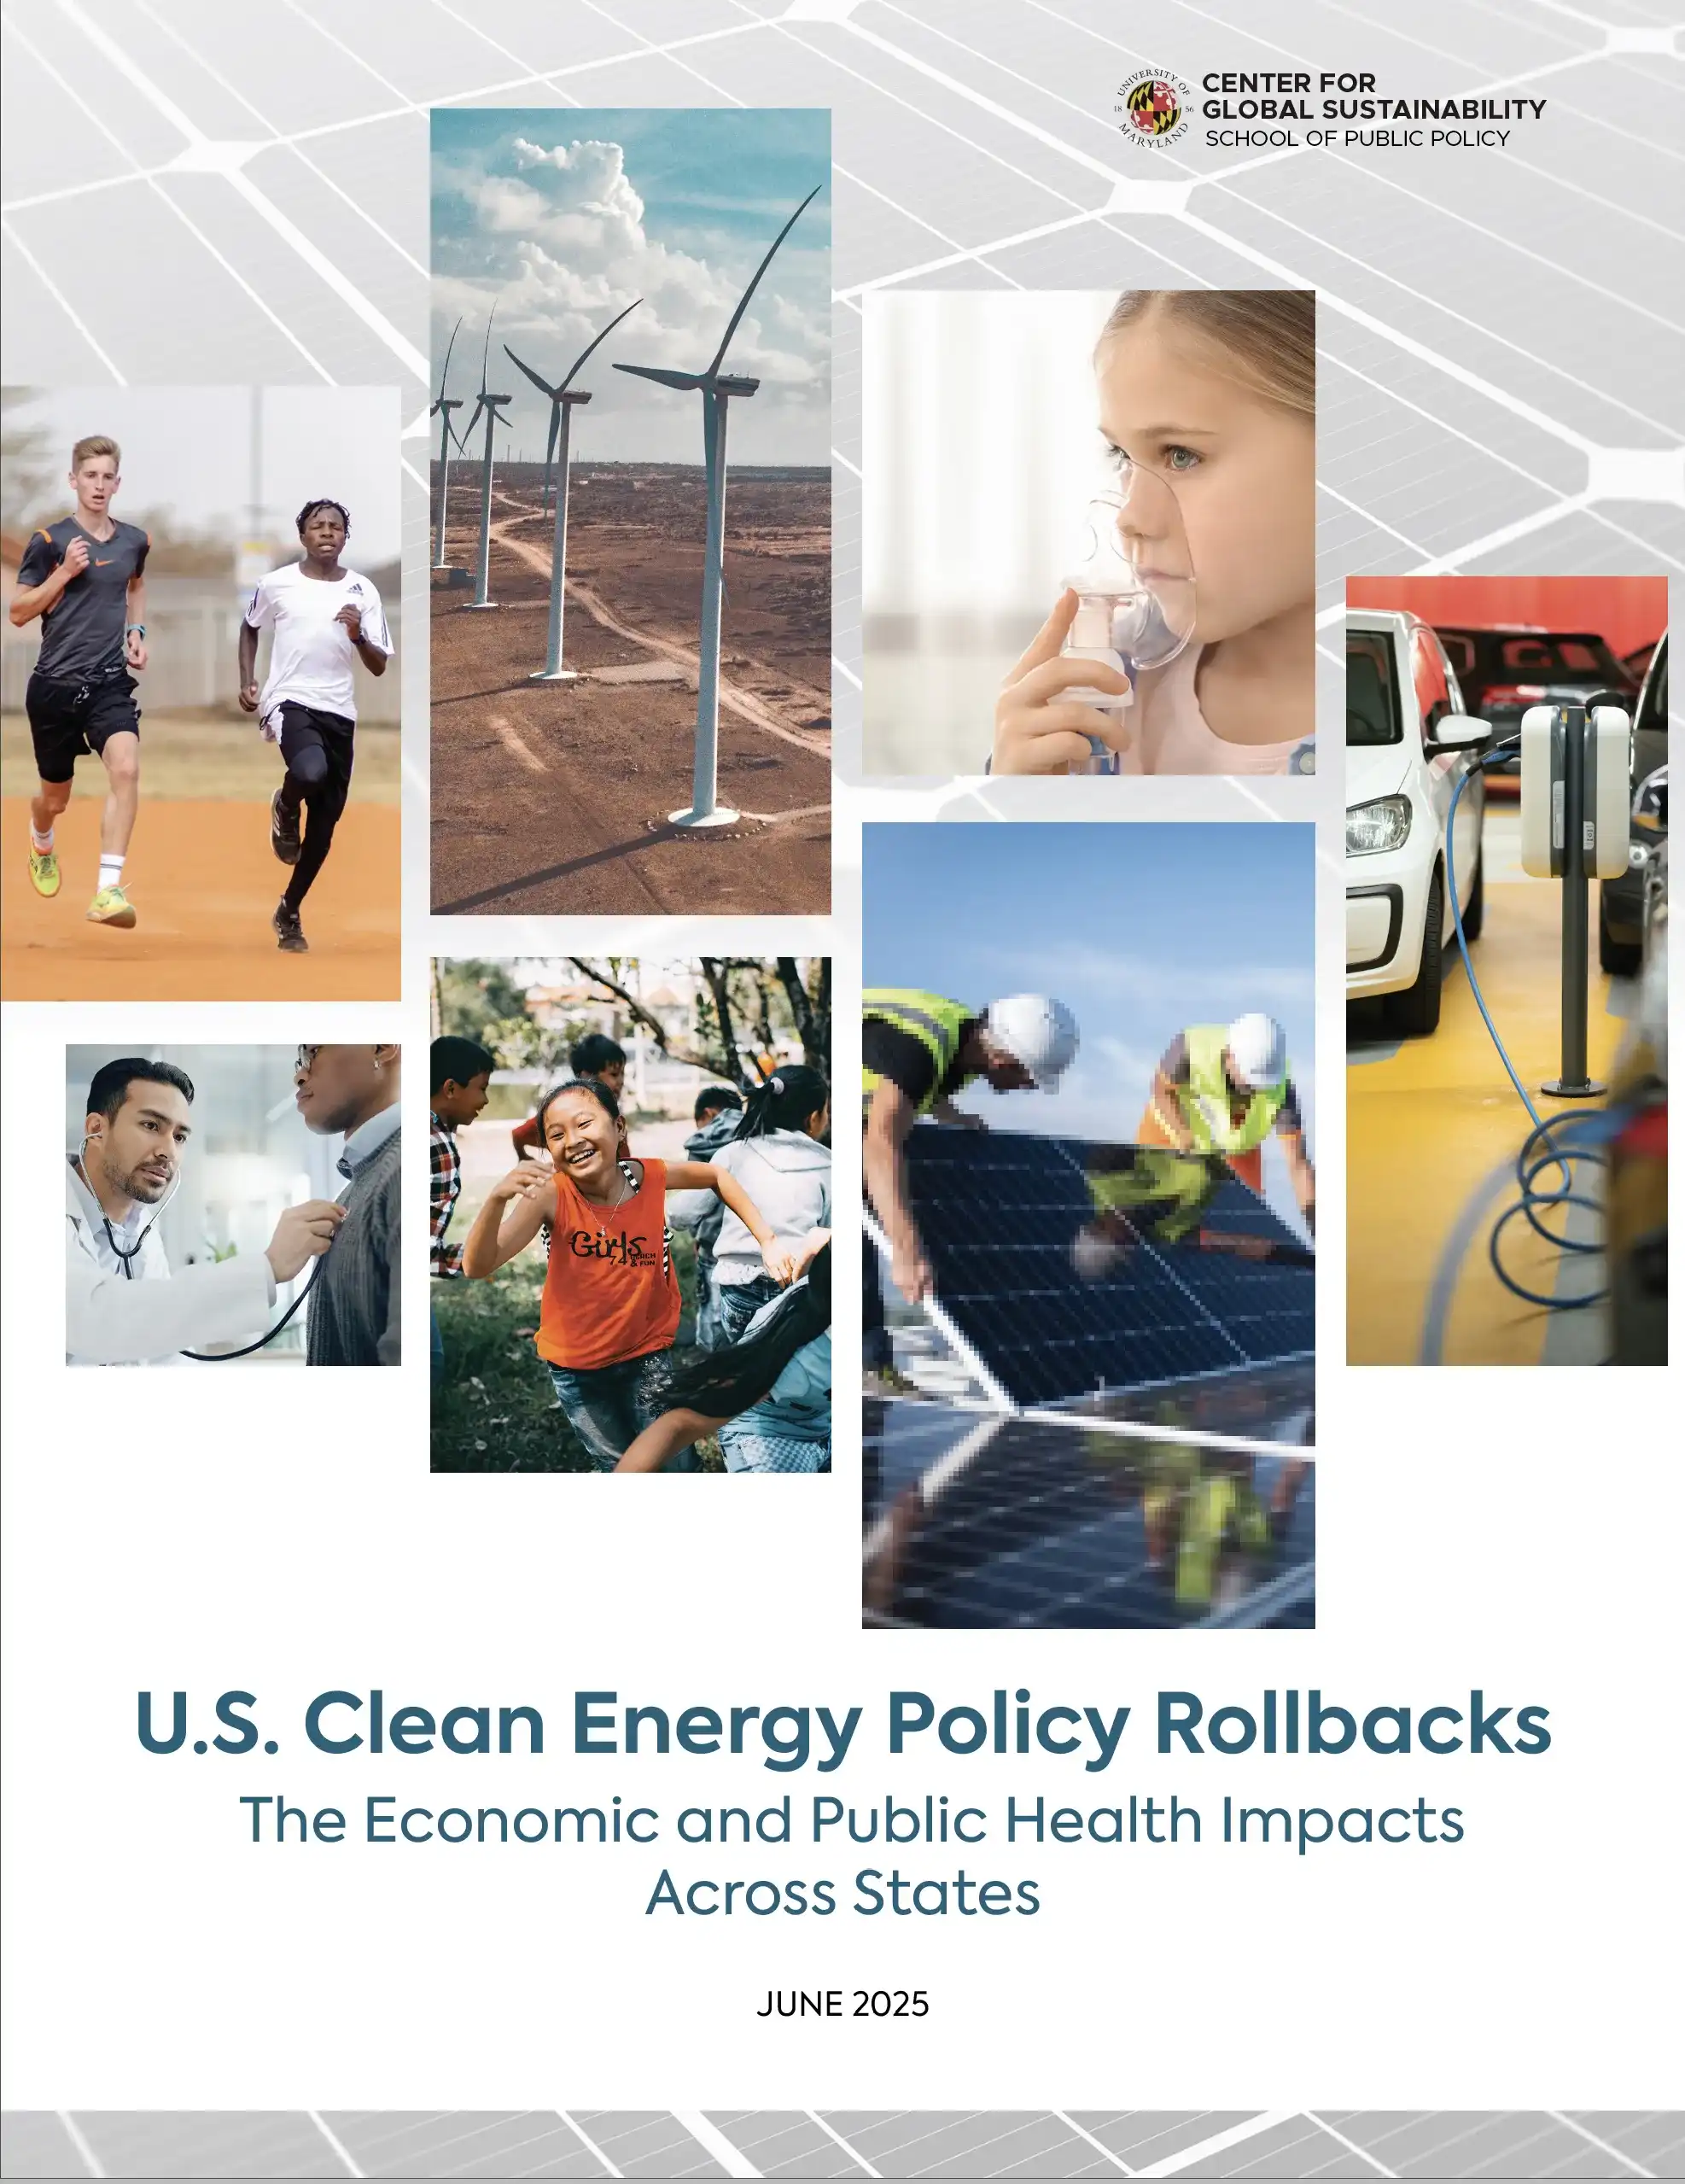
U.S. Clean Energy Policy Rollbacks
The Economic and Public Health Impacts
Across States
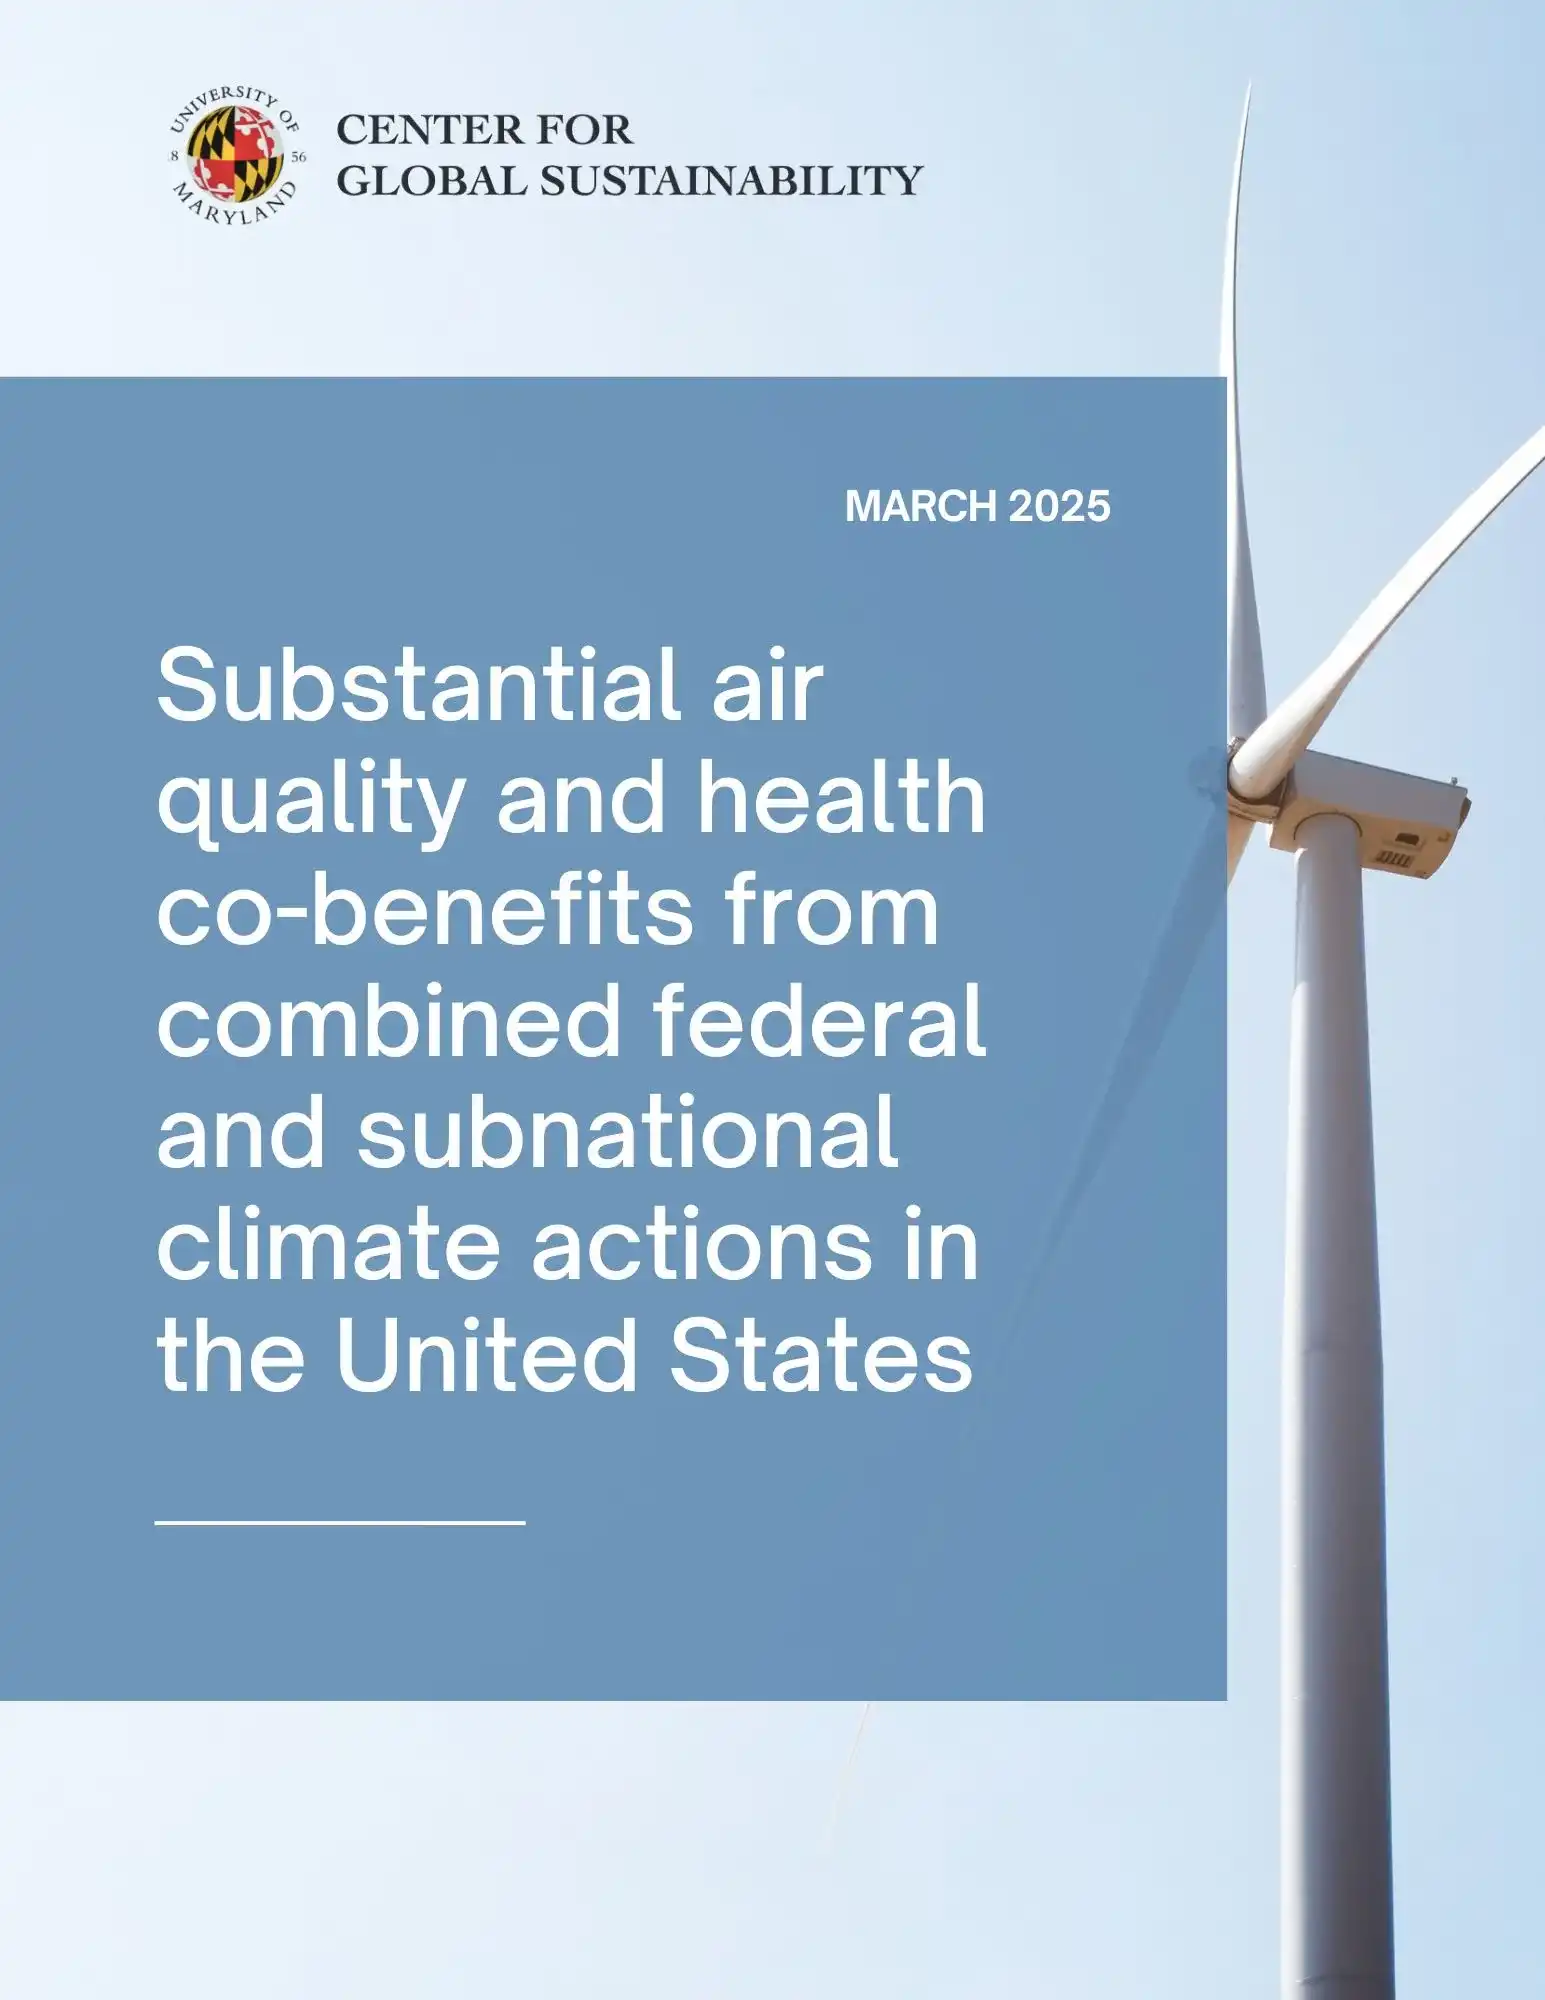
Substantial air quality and health co-benefits from combined federal and subnational climate actions in the United States
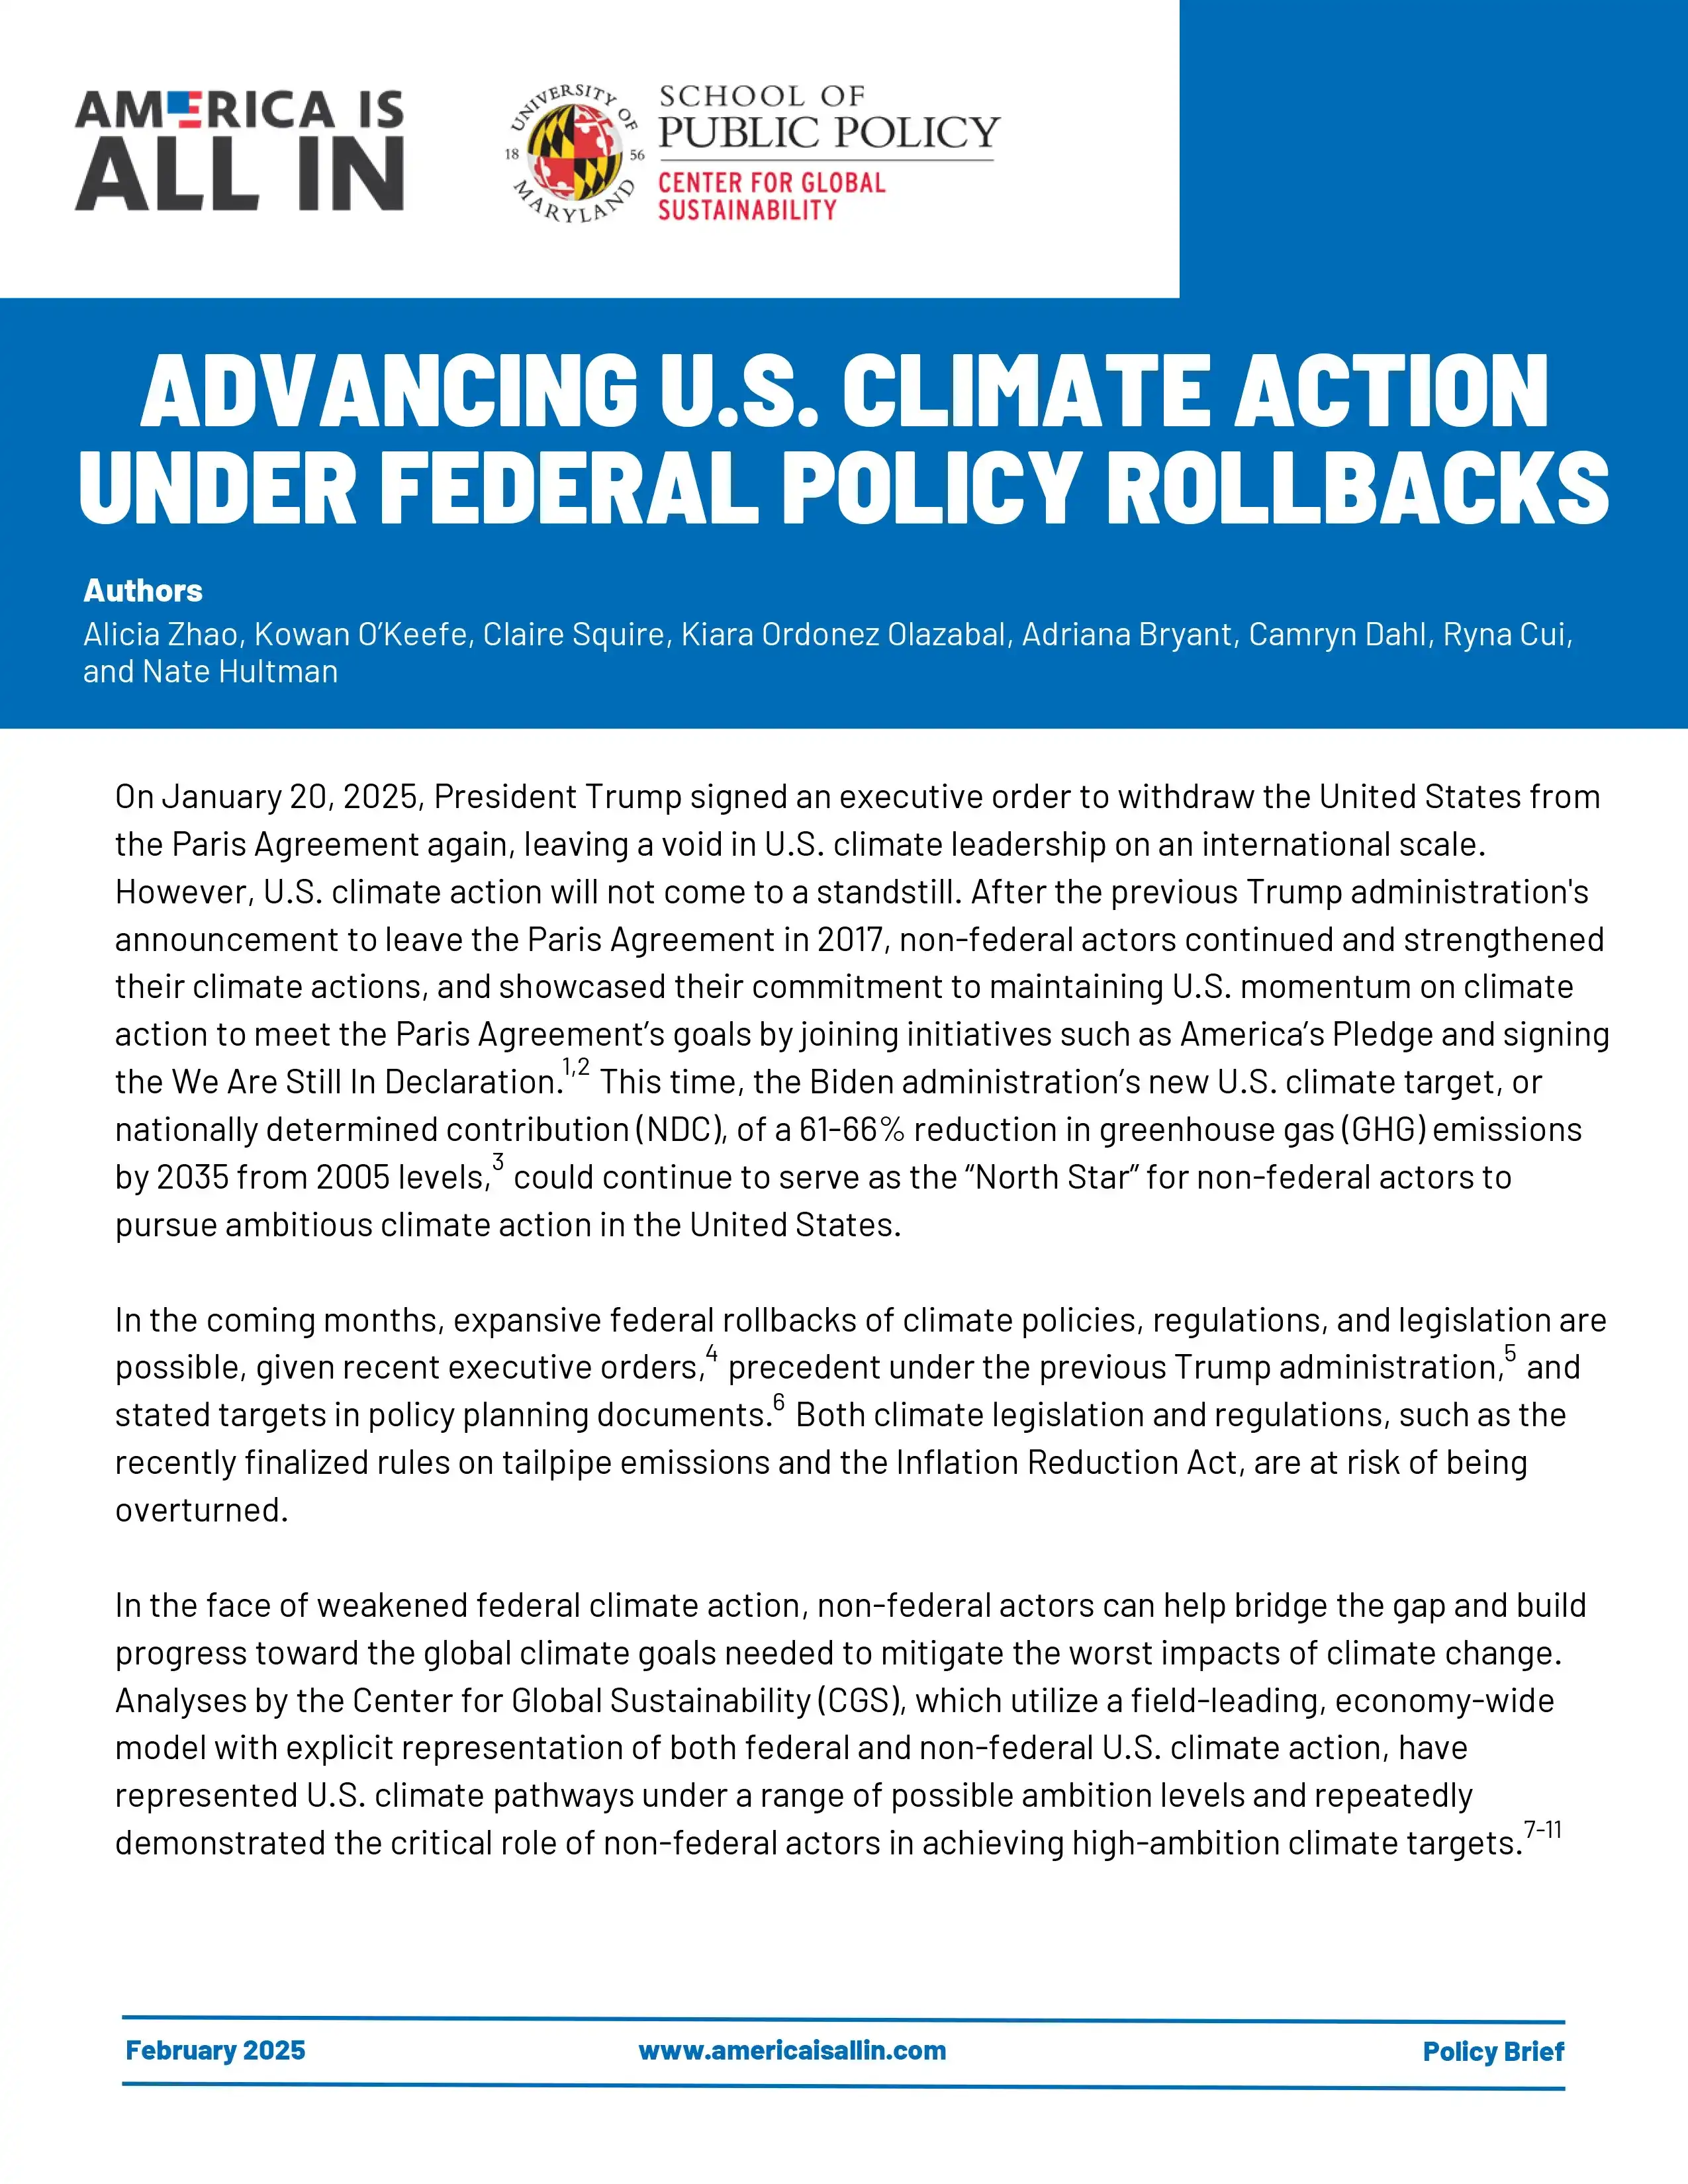
Advancing U.S. Climate Action under Federal Policy Rollbacks
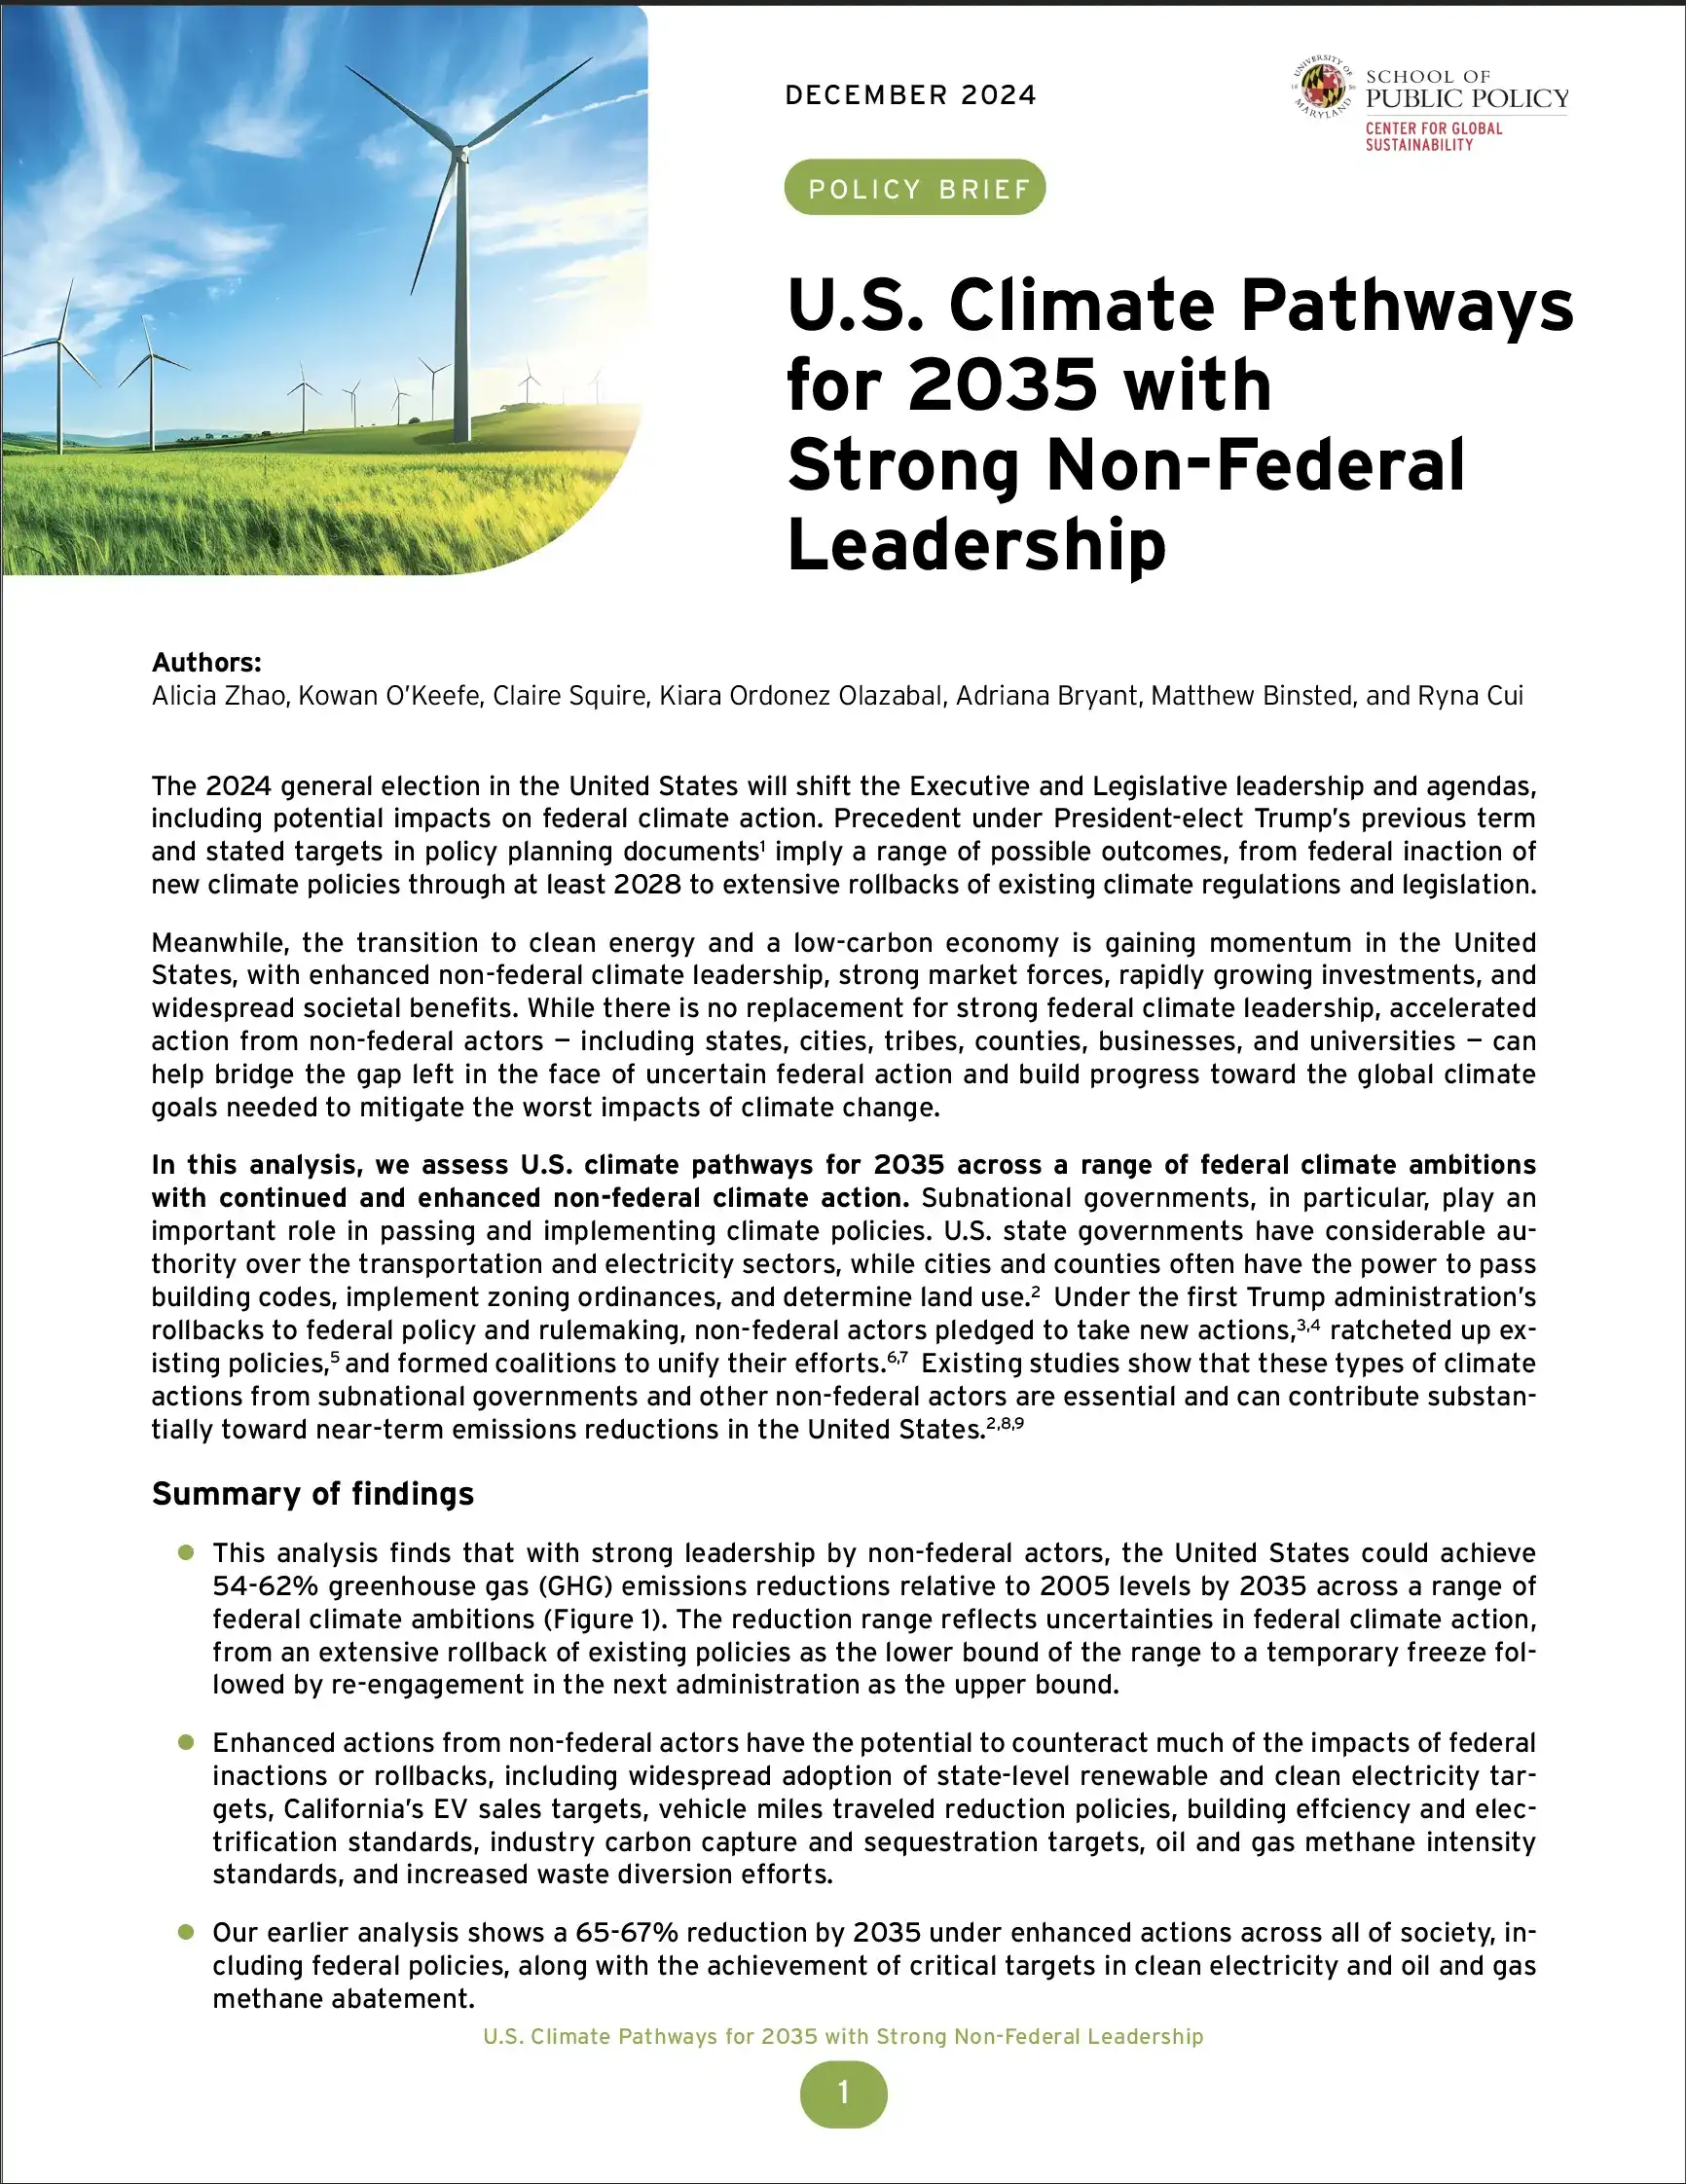
U.S. Climate Pathways for 2035 with Strong Non-Federal Leadership
Toward 2035: Forging A High-Ambition U.S. Climate Pathway
High-ambition climate action in all sectors can achieve a 65% greenhouse gas emissions reduction in the United States by 2035
A multi-model study to inform the United States’ 2035 NDC
Leading the Way To Greater 2035 Climate Ambition: A Snapshot of Current
State-Level Initiatives
The State of Global Coal Power Factsheet Series: United States